Proving Our Results-driven Approach
Always-On Visibility. Always-On Reliability.
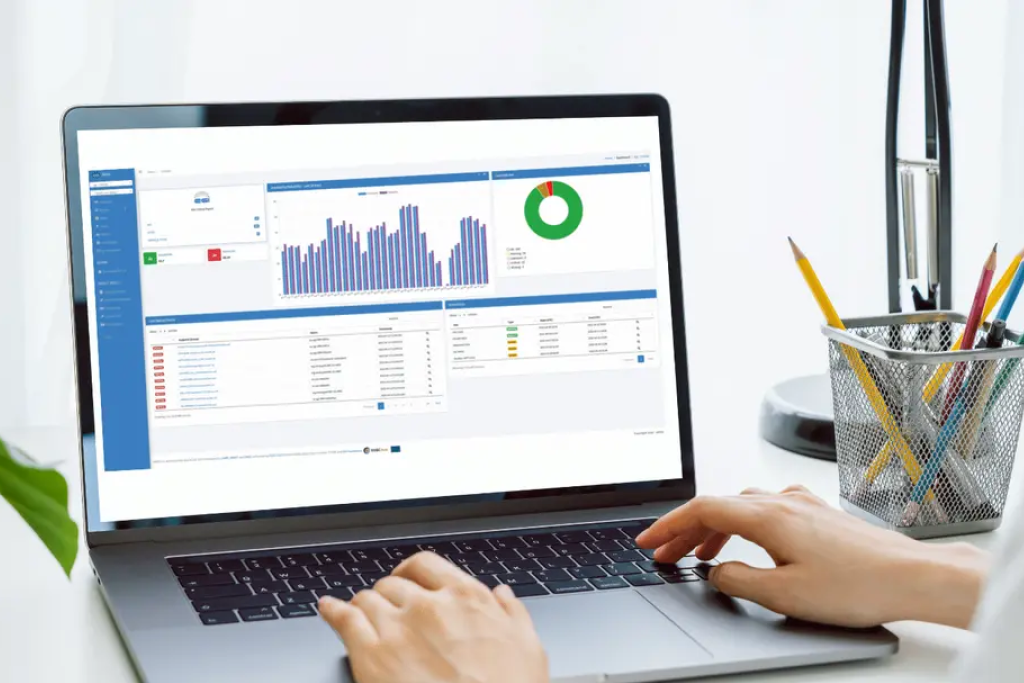
Downtime costs more than dollars. It costs trust, and Codiea’s server monitoring and performance optimisation services give you real-time visibility into every metric, log, and trace. We use Prometheus, Grafana, and ELK Stack. Brilliantly design infrastructure monitoring systems that detect anomalies early, alert smartly, and keep your applications performing.
Track metrics, logs, and traces across servers with Prometheus and Grafana dashboards.
Get meaningful notifications using PromQL-based rules, not alert fatigue.
Fine-tuned resource allocation, auto-scaling, and FinOps insights to reduce spend.
Full observability setup using ELK / OpenSearch, enabling faster root-cause analysis.
Codiea’s server monitoring and optimisation services give DevOps and engineering teams the clarity they need to act fast. We deploy Prometheus exporters for metrics collection, Grafana dashboards for visualization, and ELK Stack (Elasticsearch, Logstash, Kibana) for log centralization. Our engineers integrate observability directly into your CI/CD pipelines, connecting metrics, logs, and traces through OpenTelemetry and Jaeger. Every deployment includes SLO and SLI tracking, real-time alerting, and continuous rightsizing. Reduce mean time to recovery (MTTR) and maintain 99.99% uptime across your infrastructure. Whether you run workloads on AWS CloudWatch, Azure Monitor, or Google Cloud Operations Suite, Codiea ensures your cloud stays predictable, cost-efficient, and resilient 24/7.
Codiea monitors uptime, CPU, RAM, disk, and network performance in real time. We combine alert automation, security tracking, and load optimization to keep servers fast and secure. Your systems stay stable, scalable, and always ready for peak demand.
We track performance through tools like Prometheus, Grafana, and CloudWatch, then fix bottlenecks before they break production. Alerts go out instantly, and we optimize load, caching, and scaling to stop outages before they happen.
Yes. Codiea supports AWS, Azure, Google Cloud, and on-premise infrastructure. We use unified monitoring dashboards and automation to track every server, container, and microservice under one secure system.
We optimize CPU usage, storage I/O, network traffic, and caching layers. Using performance benchmarking and FinOps-driven tuning, we reduce server waste and increase speed without changing the application code.
Pricing depends on server count, cloud resources, and monitoring depth. Every client receives a detailed performance baseline, tool stack proposal, and transparent monthly cost. No hidden fees, no vendor lock-ins.


We’re happy to answer any questions you may have and help you
determine which of our services best fit your needs.